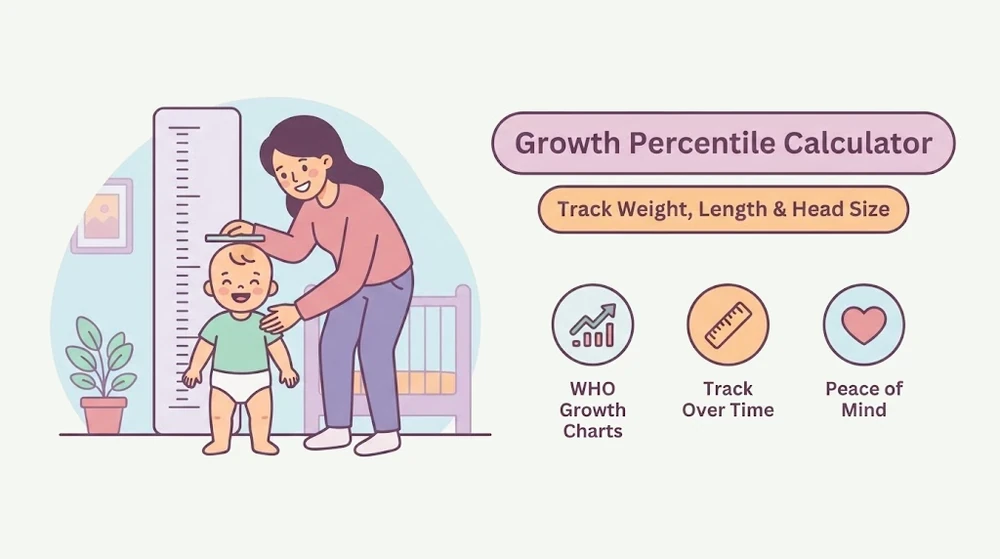
As parents, we're all a little worried about our baby's growth at some point. Is she growing at a healthy rate? Is her weight normal? Is her height on track? These are some of the most common questions new parents ask — and comparing against the WHO growth chart is one of the best ways to get a clear answer.
On this page, you can check your baby's weight, length and head circumference percentiles using the WHO Child Growth Standards. Just enter your baby's sex, age and whichever measurements you have, and see where your baby falls on the growth percentile.
Calculated from the official WHO Child Growth Standards reference tables (0–24 months). Your pediatrician's chart accounts for your baby's full growth history and is always the authoritative source — this tool is for general information, not diagnosis.
A percentile compares your baby to a reference population of babies the same age and sex. A baby at the 60th percentile for weight weighs more than roughly 60% of babies their age — it's a relative comparison, not a grade. The 50th percentile is the median, not a "correct" target, and a baby can be perfectly healthy anywhere from the 3rd to the 97th percentile.
A single percentile number matters far less than the trend over time. A baby who's consistently tracked around the 20th percentile since birth is likely growing exactly as they should — for them. What pediatricians watch for is a sudden, sustained shift across two or more major percentile lines in either direction, which can (though doesn't always) signal something worth a closer look.
Each measurement tracks something different. Weight-for-age reflects overall body mass and can shift quickly with illness, feeding changes or growth spurts. Length-for-age reflects skeletal growth and tends to be steadier over time. Head circumference-for-age tracks brain and skull growth and is watched closely in the first two years. A baby can sit at different percentiles on each of the three — that's normal, and doctors typically look at all three together rather than any one in isolation.
The WHO Child Growth Standards used in this calculator are based on breastfed infants from multiple countries and are recommended for children under 2 in the US and most other countries. The CDC charts, used more often from age 2 onward, are based on a US reference population. Your pediatrician will typically use whichever is standard for your baby's age.
Growth charts are usually drawn with curves at the 3rd, 15th, 50th, 85th and 97th percentiles. The chart above plots your baby's point against the 3rd, 50th and 97th percentile lines for their age, so you can see at a glance whether a measurement sits near the middle of the range or closer to an edge — either of which can be entirely normal for an individual baby.
Percentiles are calculated using the official WHO Child Growth Standards LMS parameter tables (L, M and S values by month, sex and measurement), converted to a percentile with the standard Box-Cox method used across clinical growth charts. Growth charts are a screening aid, not a standalone diagnostic tool — always discuss your baby's growth with your pediatrician.
Log every weight, length and head circumference check — BabyQuil plots your baby's personal growth curve over time. You can also track feeding, sleep and milestones alongside it.
Get BabyQuil — free on iOS